How to use closed-ended questions correctly
Closed-ended questions are used in almost all types of surveys. They are simple, clear and easy to fill in for respondents. Nevertheless, mistakes are still being made in choosing them which we only realize when we see the results.

What are closed-ended questions?
We have already written about closed-ended questions in the first part of our series devoted to the question types.
Let us just remind you that a closed-ended question is one in which all the answer options are already pre-set and the respondent cannot add another one. There are several types of closed-ended questions, let’s focus on the traditional two of them: selective and enumerated. We have also mentioned that there are even other descriptions used for these questions.
| single choice | multiple choice |
| selective | enumerated |
| selective | alternative |
| one answer | multiple answers |
What’s important to mention is that in a selective question, the respondent can choose only one answer whereas more answers are chosen in an enumerated question.
Do you know how to use the closed-ended questions correctly?
The difference between the questions is most obvious in its results. Let’s see an example.
We will use both the selective and enumerated questions for the following query:
What is your favourite season?
In the picture, you can see that the question is exactly the same, but in the first case it is a selective question, in the latter case an enumerated question.
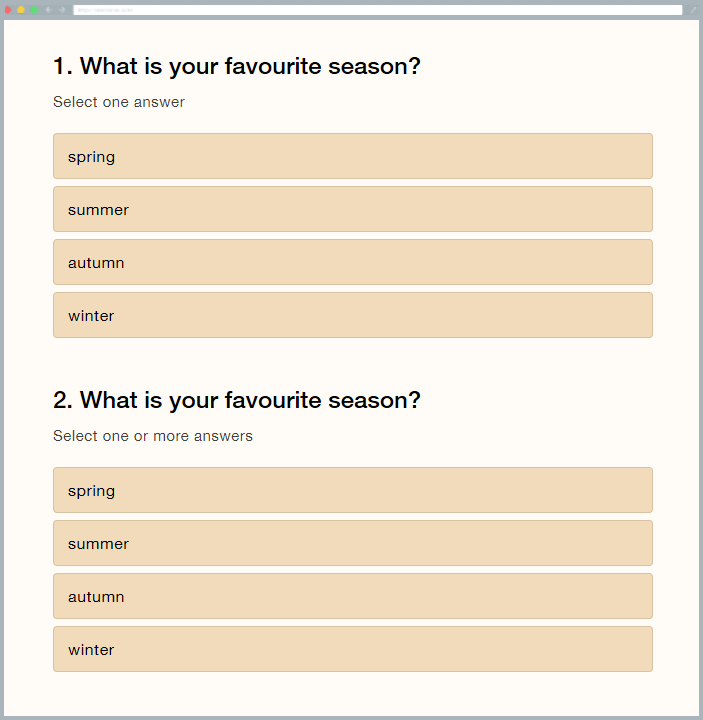
Both questions look the same. They may only differ in their help text. But in the first example, the respondent can only choose one of the variants. In the latter case, he can choose all of them.
In the latter example, many respondents are likely to choose only one of the answers, but there will still be some that check more or even all of them. This may be because they like all seasons equally. But it is clear from the nature of the question that you want the respondent to choose only one option, because there is a superlative used in the question – favourite.
What will the results look like?
Let’s say that we’ve sent the survey to two groups of respondents and in both cases, 200 people have completed it.

Selective question
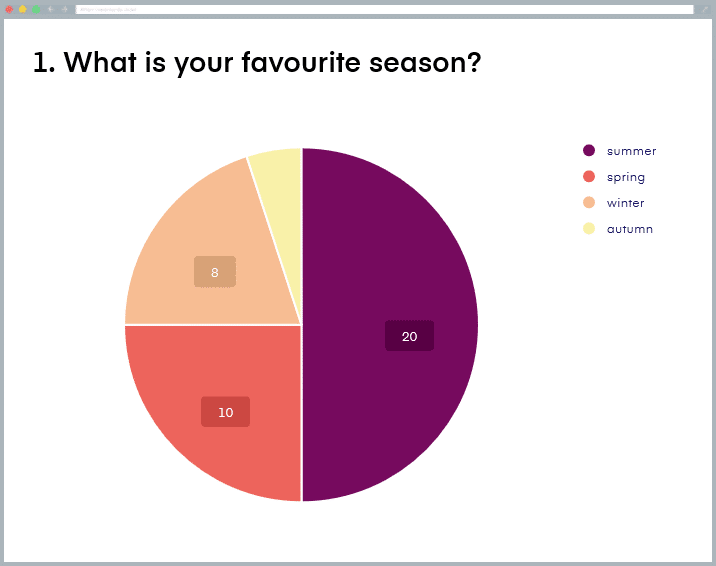
In case of using a selective question, the representation of data is very simple, because the sum of the answers is equal to the number of respondents. We can also take full advantage of the potential for relative expression („percentage„) because the sum of all shares („percent„) of each season will be equal to 100%.
We can easily use any type of diagram to display the results, including a pie chart. That way, it’s clear to state how popular the individual seasons are for the respondents.
Chart: Calculation of results for selective question (n=40)
| Season | Number of answers | Relative number of answers |
| spring | 10 | 25 % |
| summer | 20 | 50 % |
| autumn | 2 | 5 % |
| winter | 8 | 20 % |
| Total | 40 | 100 % |
We often use the selective question in contingency tables which show us the structure of answers according to another variable (question), e.g. gender. We will show it again with the example of such a table.
Table: Example of contingency table: Popularity of seasons by gender
| Gender | Season | Total | |||
| spring | summer | autumn | winter | ||
| female | 6 | 12 | 0 | 2 | 20 |
| male | 4 | 8 | 2 | 6 | 20 |
| Total | 10 | 20 | 2 | 8 | 40 |
Enumerated question
Now, let’s take a look at the other case where respondents can fill in any number of answers.
Chart: Calculation of results for enumerated question (n = 340)
| Season | Number of answers | Share of the number of respondents | Share of the number of responses |
| spring | 70 | 35 % | 21 % |
| summer | 140 | 70 % | 41 % |
| autumn | 500 | 25 % | 15 % |
| winter | 80 | 40 % | 24 % |
| Total | 340 | 170 % | 100 % |
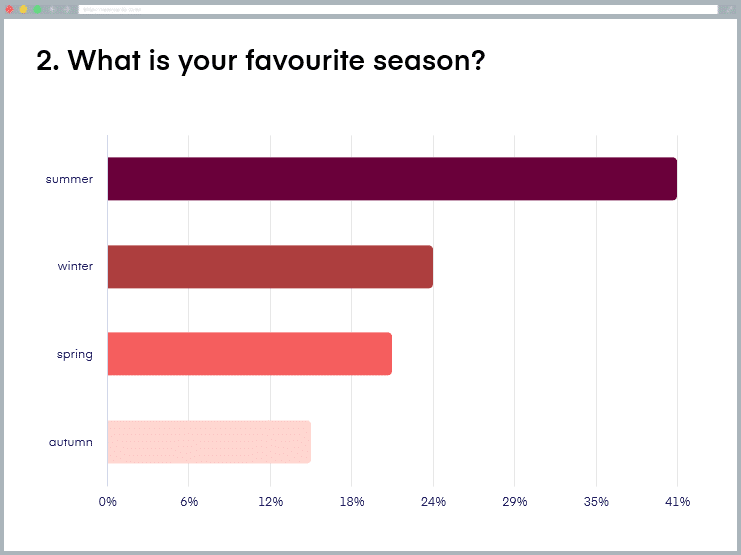
As can be seen from the calculation, the number of answers is not equal to the number of respondents, and if we used the same calculation as in the previous case, the sum would not be 100% but 170%. Therefore, it is definitely not possible to use a pie chart. A possible alternative is not calculating the share of the number of respondents but of the total number of answers. However, in this case, we are already looking at completely different information.
Another significant disadvantage of the enumerated question is that you cannot use it in a contingency table. This will deprive you of using the possibility of evaluating the relationships between the individual variables (e.g. calculating the dependence). Although we can get a chart of multiple answers that looks similar, the total sums will not make sense as the number of respondents will still remain 200, while the number of answers is 340.
On the other hand, though, definitely do not reject the enumerated question either. Just make sure to use it when you really expect more answers to your question.
Remember that if you are going to ask questions, first, try to think about what information you want to get from the questionnaire and what questions to choose to get that information.
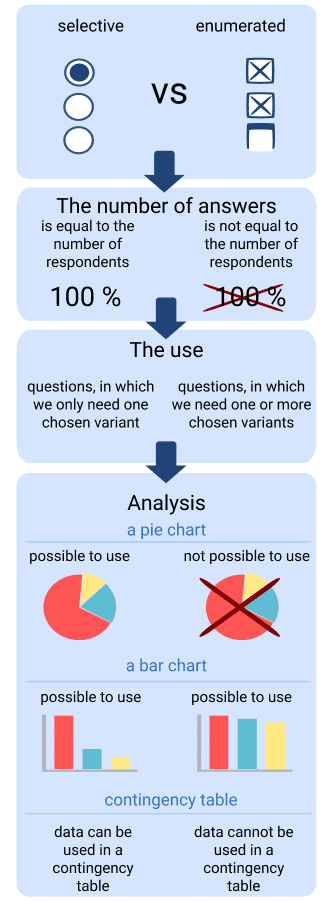
Use a basic rule when deciding about using closed-ended questions. If you want only one answer, use a selective question; if you want more than one answer, use an enumerated question.
Finally, a little summary in clear infographics:
In case of questions, suggestions or comments (not only regarding our article), do not hesitate to contact us via Facebook, Twitter or via e-mail!
Vocabulary
- Pie chart – this is a diagram that shows the shares of individual questions (variables) in the whole. The condition is that the values must be equal to 100% of the total sum of shares. It’s alternatively called circle chart. It is not possible to use it for enumerated types of questions.
- Bar chart – a graph showing data in relative or absolute values. Horizontal or vertical bars are used to express the intensity of each variable.
- Relative frequency – expresses the share of a specific answer (variable) in the total number of answers; usually expressed as a percentage.
- Respondent – a research participant who answers questions.
Create your own questionnaire or survey for free
Setting up your first survey is quick and straight forward. Choose from one of 100 predefined templates or create your own from the scratch. Start getting your first responses in 5 minutes.
Create your own survey