Net Promoter Score®: How to process the NPS results – Part 2
Net Promoter Score®, a method that by asking a trivial, apt question helps companies around the globe to find out how loyal their customers or users are. In the previous part of our NPS® series, we learned how this popular tool actually works, how it is used, and what its results look like. This time, we will focus on how to interpret the measured values and whether this method is really as flawless as it seems at first glance.

What to do with the collected values?
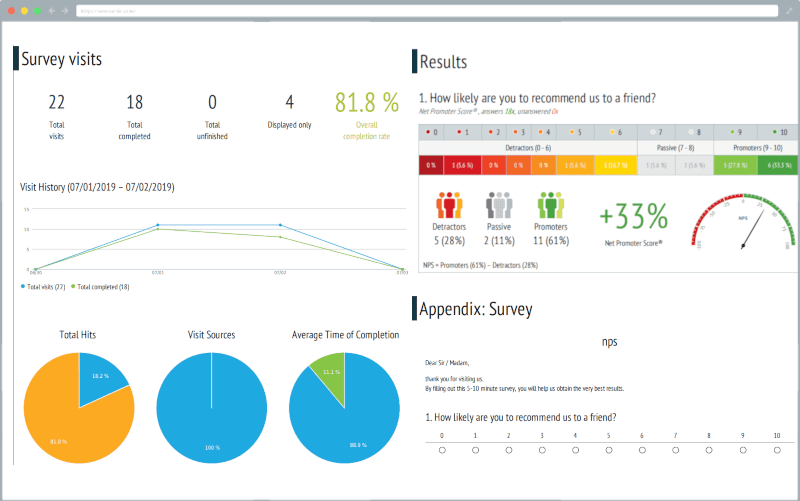
The obtained NPS® results are collected in regular overviews, whose content, frequency, or to whom and in what cases they will be sent, can be adjusted and changed at any point. For example, a manager who at the same time takes care of multiple affiliates, can easily compare them with one another. Each company also needs to have figured out how these results will be further managed – who will process them, what to focus on, which team will be the impetus and which the executor of possible changes.
An advantage of these reports is that they can easily be compared with each other when there is a large amount of data. It creates a kind of success curve of your company and also in comparison with other companies. So you can easily detect that a mistake has been made, or that everything is going fine, as well as how your competitors are doing. In addition, a number of companies have shown a direct link between their economic results and a high NPS®, which is logical because the more customers you have the better the company is doing. Thus, we can point out a straight line between loyalty growth and business growth.
These values can also become an important indicator of how your company is handling various exceptional situations. For instance, you may notice alterations in client satisfaction after making major changes, or a generally decreasing level of satisfaction amongst your regular customers and solve their problems before they decide to flee to your competitor. On the other hand, you can use the highly positive feedback to enhance the overall positive impression of your business, and steer the Promoters to write a more extensive review on evaluation platforms.
The NPS® method is not immaculate
Naturally, we have to bear in mind that NPS® is not an in-depth method and the gathered information is relatively simplified. NPS® will not provide any specific details regarding the problems and what’s caused them. It is also worth the discussion about how much the evaluators are influenced by their current state of mind. Whether they think through their assessment carefully, how they perceive the evaluation scale and the nuances between individual values. Moreover, it is not possible to tell with certainty whether respondents rated their satisfaction with the service or the product itself and whether they still would recommend your company in reality.
All of this is a sacrifice for speed and ease – the prevailing reasons for more and more companies to start or keep using this method. The evaluator doesn’t waste too much time and thus responds more likely. Besides, alone, without any external influences, so probably all the more credibly. In addition, NPS® works with customer experience, unlike other measurements that only address finances. All together, this underlines the fact that, despite its inaccuracies, NPS® is a solid metric. However, we must realize that it is only necessary to perceive NPS® as one of many sources of feedback. It is recommended to combine it with other alternative sources to gather more accurate information.
Some alternative feedback sources may be:
- Ease of Doing Business Index (national assessment from the corporate perspective)
- Customer Satisfaction Index ECSI and ACSI (Europian / American Customer Satisfaction Index)
- Customer Effort Score (“How difficult was it to finish the purchase?”)
- SERVQUAL (difference between customer expectation and perception – based on gap analysis)
- KANO (customer preferences for each quality category – “Must-be”, “One-dimensional”, “Attractive”, “Indifferent” and “Reverse Quality”)
- or NVS (Net Value Score).
These methods are however often very complex and much more complicated to control and analyse, compared to NPS®.
Obviously, NPS® can represent a very good source of information and provide valuable data. However, the deciding factor always is whether there’s a will to transfer the gathered information into decisions and how those decisions will be executed. It is also important to establish how various components of the company communicate and share this information amongst each other.
In the third part of our series, we will focus on a practical use of the NPS® method, specifically at Webnode, which has been actively practicing it for several years. Are you curious about what they have noticed and found out over the years, what fits them perfectly and what they would like to change? Follow us and share all your possible questions, ideas or comments with us on Facebook, Twitter or via e-mail & stay posted!
Create your own questionnaire or survey for free
Setting up your first survey is quick and straight forward. Choose from one of 100 predefined templates or create your own from the scratch. Start getting your first responses in 5 minutes.
Create your own survey